|
|
 |
Analyze DataOnce data has been processed through by the Normalization step the data can be moved on the the final step which is the detection of differentially expressed genes. Currently the default method is SAM originally developed by Tusher et al. and implemented in R-Bioconductor within the "siggenes" library
| Start an Analysis run | Follow these steps to start a new analysis run. A previous Normalization analysis run must be present to continue
| 1) | Log into Sbeams
| |
| 2) | Select the Microarray Link in the main navigation bar
| |
| 3) | Select the Project of interest at the top of the page
| |
| 4) | Select the Data Pipeline Button on the main navigation bar
| |
| 5) | If the project has Affy data a link to "Affy Analysis Pipeline" will be displayed at the bottom of the page, Click the link
| |
| 6) | Click on the "Normalized Data" tab to see any previous runs
| |
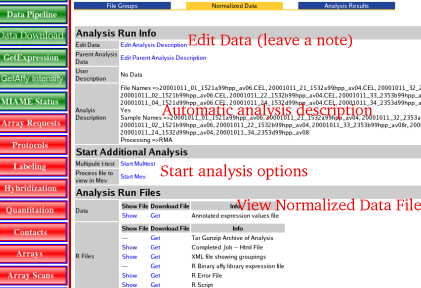
| 7) | Click on the "Show files" link for the normalization run of interest
| |
| 8) | Click the link Under the heading Start Additional Analysis --> Start Multtest
| |
| 9) | (Currently the name Multtest is a hold over from the Bioconductor Pages)
| |
|  |
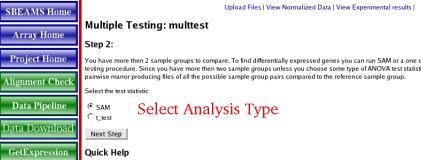
| Select Analysis Type | Currently the pipeline supports analysis via SAM or a variant of a t-test and a variety of false discovery methods. Go to the Bioconductor web page and read about the webbioc library if you wish to use any of the options on the "t_test" link. Using a test data set from Affymetrix, A549 Latin Square test data, where different mRNA were spiked in at a variety of concentrations, SAM was used to identify the "differentially" expressed genes in a robust manor so it was chosen as the default method for analysis.
| 1) | SAM Background Info
| |
| 2) |
SAM analysis description from Tusher et al. [1] "SAM identifies genes with statistically significant changes in expression by assimilating a set of gene-specific t tests. Each gene is assigned a score on the basis of its change in gene expression relative to the standard deviation of repeated measurements for that gene. Genes with scores greater than a threshold are deemed potentially significant. The percentage of such genes identified by chance is the false discovery rate (FDR). To estimate the FDR, nonsense genes are identified by analyzing permutations of the measurements. The threshold can be adjusted to identify smaller or larger sets of genes, and FDRs are calculated for each set."
| |
| 3) | 1) Significance analysis of microarrays applied to the ionizing radiation response. Proc Natl Acad Sci U S A. 2001 Apr 24;98(9):5116-21. Epub 2001 Apr 17. Erratum in: Proc Natl Acad Sci U S A 2001 Aug 28;98(18):10515.
| |
|  |
| SAM analysis options | Currently there are not many options other then controlling what data is displayed in the output files.
| 1) | File Types
| |
| 2) | HTML: Will show just the top differentially expressed genes for each of the conditions.
| |
| 3) | TXT: File that contains all the genes ranked by the FDR (see below for more information about FDR rates
| |
| 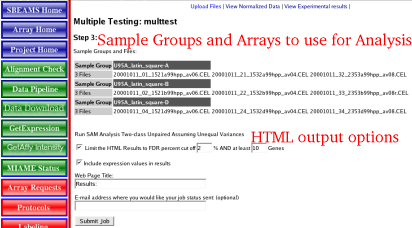 |
| SAM analysis process | When the run is started the Reference Sample Group (Chosen before the normalization step) is compared to all other sample groups. For each comparison a "Condition" is produced which allows the reference sample group to be compared to second sample group and the data can be shown as a expression ratio. The significance of the expression ratio can be determined by the False Discovery Rate (FDR - see below for more info)
| 1) | Example of Analyzing 4 sample groups
| |
| 2) | Sample groups A,B,C,D have been normalized together
| |
| 3) | Sample group A is the reference sample
| |
| 4) | The following conditions will be produced
| |
|
A_vs_B
A_vs_C
A_vs_D
|
|
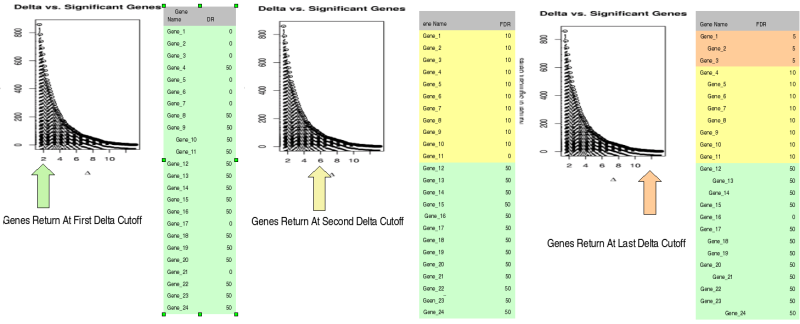
| False Discovery Rates | SAM analysis is usually ran in an interactive manor, a user would choose a Delta cutoff, the computer would then calculate which genes are significant and determine the FDR. If the user wanted to see few genes a larger Delta cutoff could be chosen which may decrease the FDR too. To make the output compatible with the GetExpression data format in SBEAMS, the data is further processed in R. Basically what happens is the data is processed by looping through all the Delta cutoff values from 0-20 (in 0.2 steps). At each step the Delta cutoff is plugged into an equation that gives back a list of significant genes and the FDR. The program keeps track of which genes are significant at each step and what the FDR rate for the group of genes. At low Delta cutoffs lots of genes will be returned but they will have a high FDR. At higher Delta cutoffs a smaller list of genes should be returned with much lower FDRs. Once again remember the user will not have to choose a FDR the program should do it for you
| 1) | Example of the genes returned at 3 different Delta cutoffs
| |
| 2) | At each Delta a list of genes is returned and a FDR is assigned
| |
| 3) | At the end of all the calculations all genes have an associated FDR
| |
| 4) | Now the data can be queried with a certain FDR, say < 5 and a list of genes will be returned. In this example it just happens to be be genes labeled Gene_01, Gene_02,Gene_03
| |
|  |
| Add data to the Get Expression Table | | Learn how to add the differentially expressed genes to the GetExpression table |
| Go Back to the Pipeline Overview | | Go Back to the Pipeline Overview |
|