|
|
 |
Normalize Affy ArraysOnce all the arrays are Group together a normalization run can be started which will perform a number of steps to pre-process the data by combining affy features into Affy probe set measurements, subtracting background and normalizing the data set to produce expression measurements
| Find the Analysis Tab | Follow the steps below to get to the page to start grouping together Affy files or Click the link
| 1) | Log into Sbeams
| |
| 2) | Select the Microarray Link in the main navigation bar
| |
| 3) | Select the Project of interest at the top of the page
| |
| 4) | Select the Data Pipeline Button on the main navigation bar
| |
| 5) | If the project has Affy data a link to "Affy Analysis Pipeline" will be displayed at the bottom of the page, Click the link
| |
| 6) | Click on the "Normalized Data" tab to see any previous runs
| |
|
| Choosing Sample Groups | Each of the Affy arrays needs to be associated with a sample group. This information will be utilized if the normalized data is moved onto the final step of finding differentially expressed genes. Most of the data should be filled in by the database to change any of the defaults follow the instructions below as needed
| 1) | To Add an extra sample group
| |
| 2) | Change the Sample Group Number from 3 to 4
| |
| 3) | Give the default Sample Group Name a new name
| |
| 4) | Make sure the sample names are in a order that make sense to the experiment since this is the order the data will be output in
| |
| 5) | Select the Reference sample. This is the sample group all other sample groups will be compared to in the final step of the pipeline. This data is not utilized in the normalization step.
| |
| 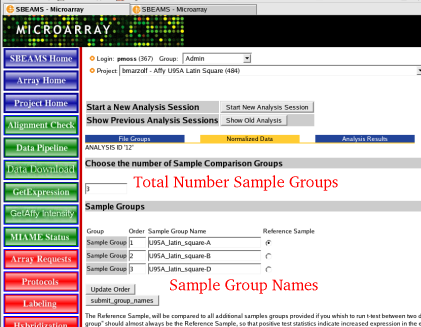 |
| Associate each file with the correct Sample Group Name | After Naming all the sample groups the association between the Affy CEL file to be analyzed and the Sample Group Name needs to be confirmed. Once again if the defaults were used there should be no need to modify this data. As an example this data would need to be changed if a Sample Group is split apart so some of the arrays should be in group X and some of the arrays should be in Group Y. This modification will have to be made below.
| 1) | To change the Sample Group Association
| |
| 2) | To change a CEL file to the appropriate group click on the Radio Button with the correct Sample Group Name
| |
| 3) | Click "Start Normalization Run" once everything is in order
| |
|  |
| Start the Normalization Run | To start the normalization run, a method to combine the probe features in to a probe set expression measurement, normalize the data and subtract background must be chosen. Currently there are two methods that wrap up all the steps into one selection. RMA and GCRMA perform all the steps listed above and gives back a spreadsheet of log 2 expression values for all the arrays. If there is a need to control some of the default options choose the Custom option which will allow fine grain control of the different steps.
| 1) | You may edit the Sample names, which will be used to annotate the results
| |
| 2) | Select default method or Custom processing method
| |
| 3) | Click "Submit Job"
| |
|  |
| Normalization Results | Once the run is complete a web page with links to the results is shown done
| 1) | Click "Show Files" link to show an overview of the results
| |
| 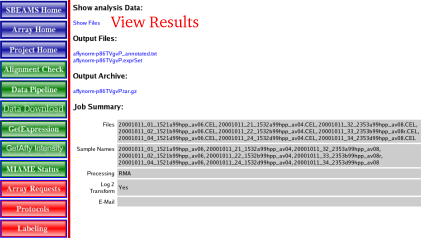 |
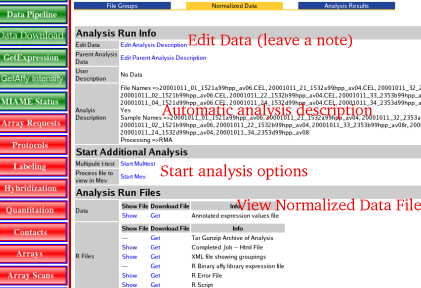
| View Results | The results page provides information about what arrays were processed, how the data was processed and links to where the data is located. All this data is saved into SBEAMS which so a user can come back at any time and view the files or use the normalized data file for further analysis.
| 1) | An Overview of some of some of the options
| |
| 2) | Add a note to why this analysis run was done, Click the "Edit Analysis Description" Link
| |
| 3) | To view the normalized data file, under the Analysis Run Files --> Data headers click "Show" to load the data into the browser. Note:this might not be to useful since it will be a large tab delimited file and will look funny in the browser
| |
| 4) | Better option to view the data: Click "Get" under the Analysis Run Files --> Data headers to load the data into a spreadsheet
| |
| 5) | To Start finding differentially expressed genes select choose an analysis method
| |
| 6) | The Files under the Analysis Run Files --> R Files where used or produced while processing the data
| |
|  |
| Go to Analysis Section | | Once the data has been Normalized, links are available to start analysis in the Pipeline or via MEV |
| Go Back to the Pipeline Overview | | Go Back to the Pipeline Overview |
|